Examples
There are 12 total dashboards available; the 6 InfluxDB dashboards are very similar to the 6 Prometheus dashboards. Below you'll find screenshots of the first four dashboards.
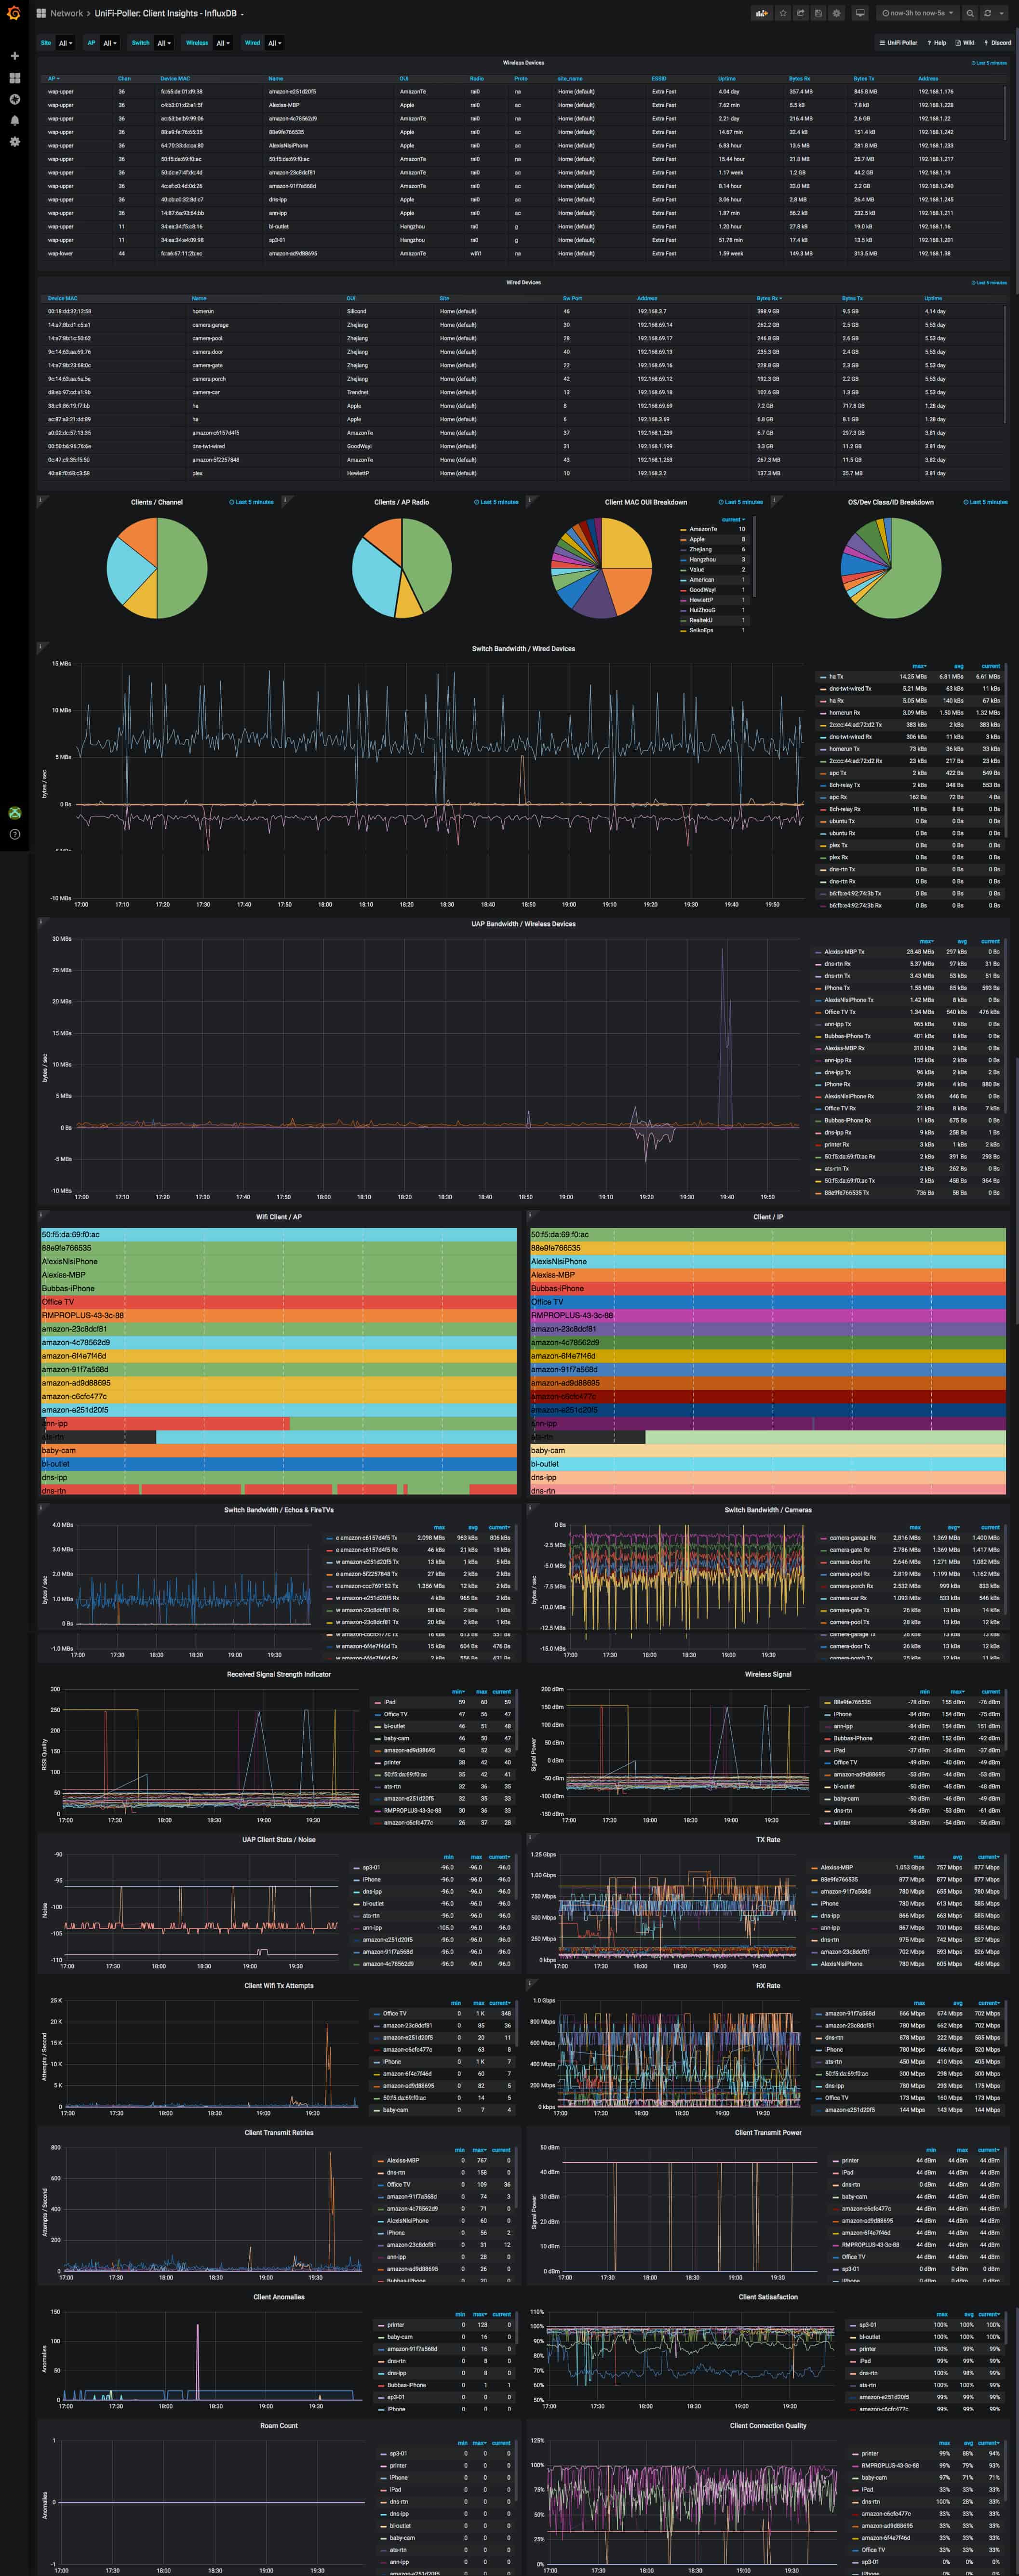
Client Dashboard (InfluxDB)
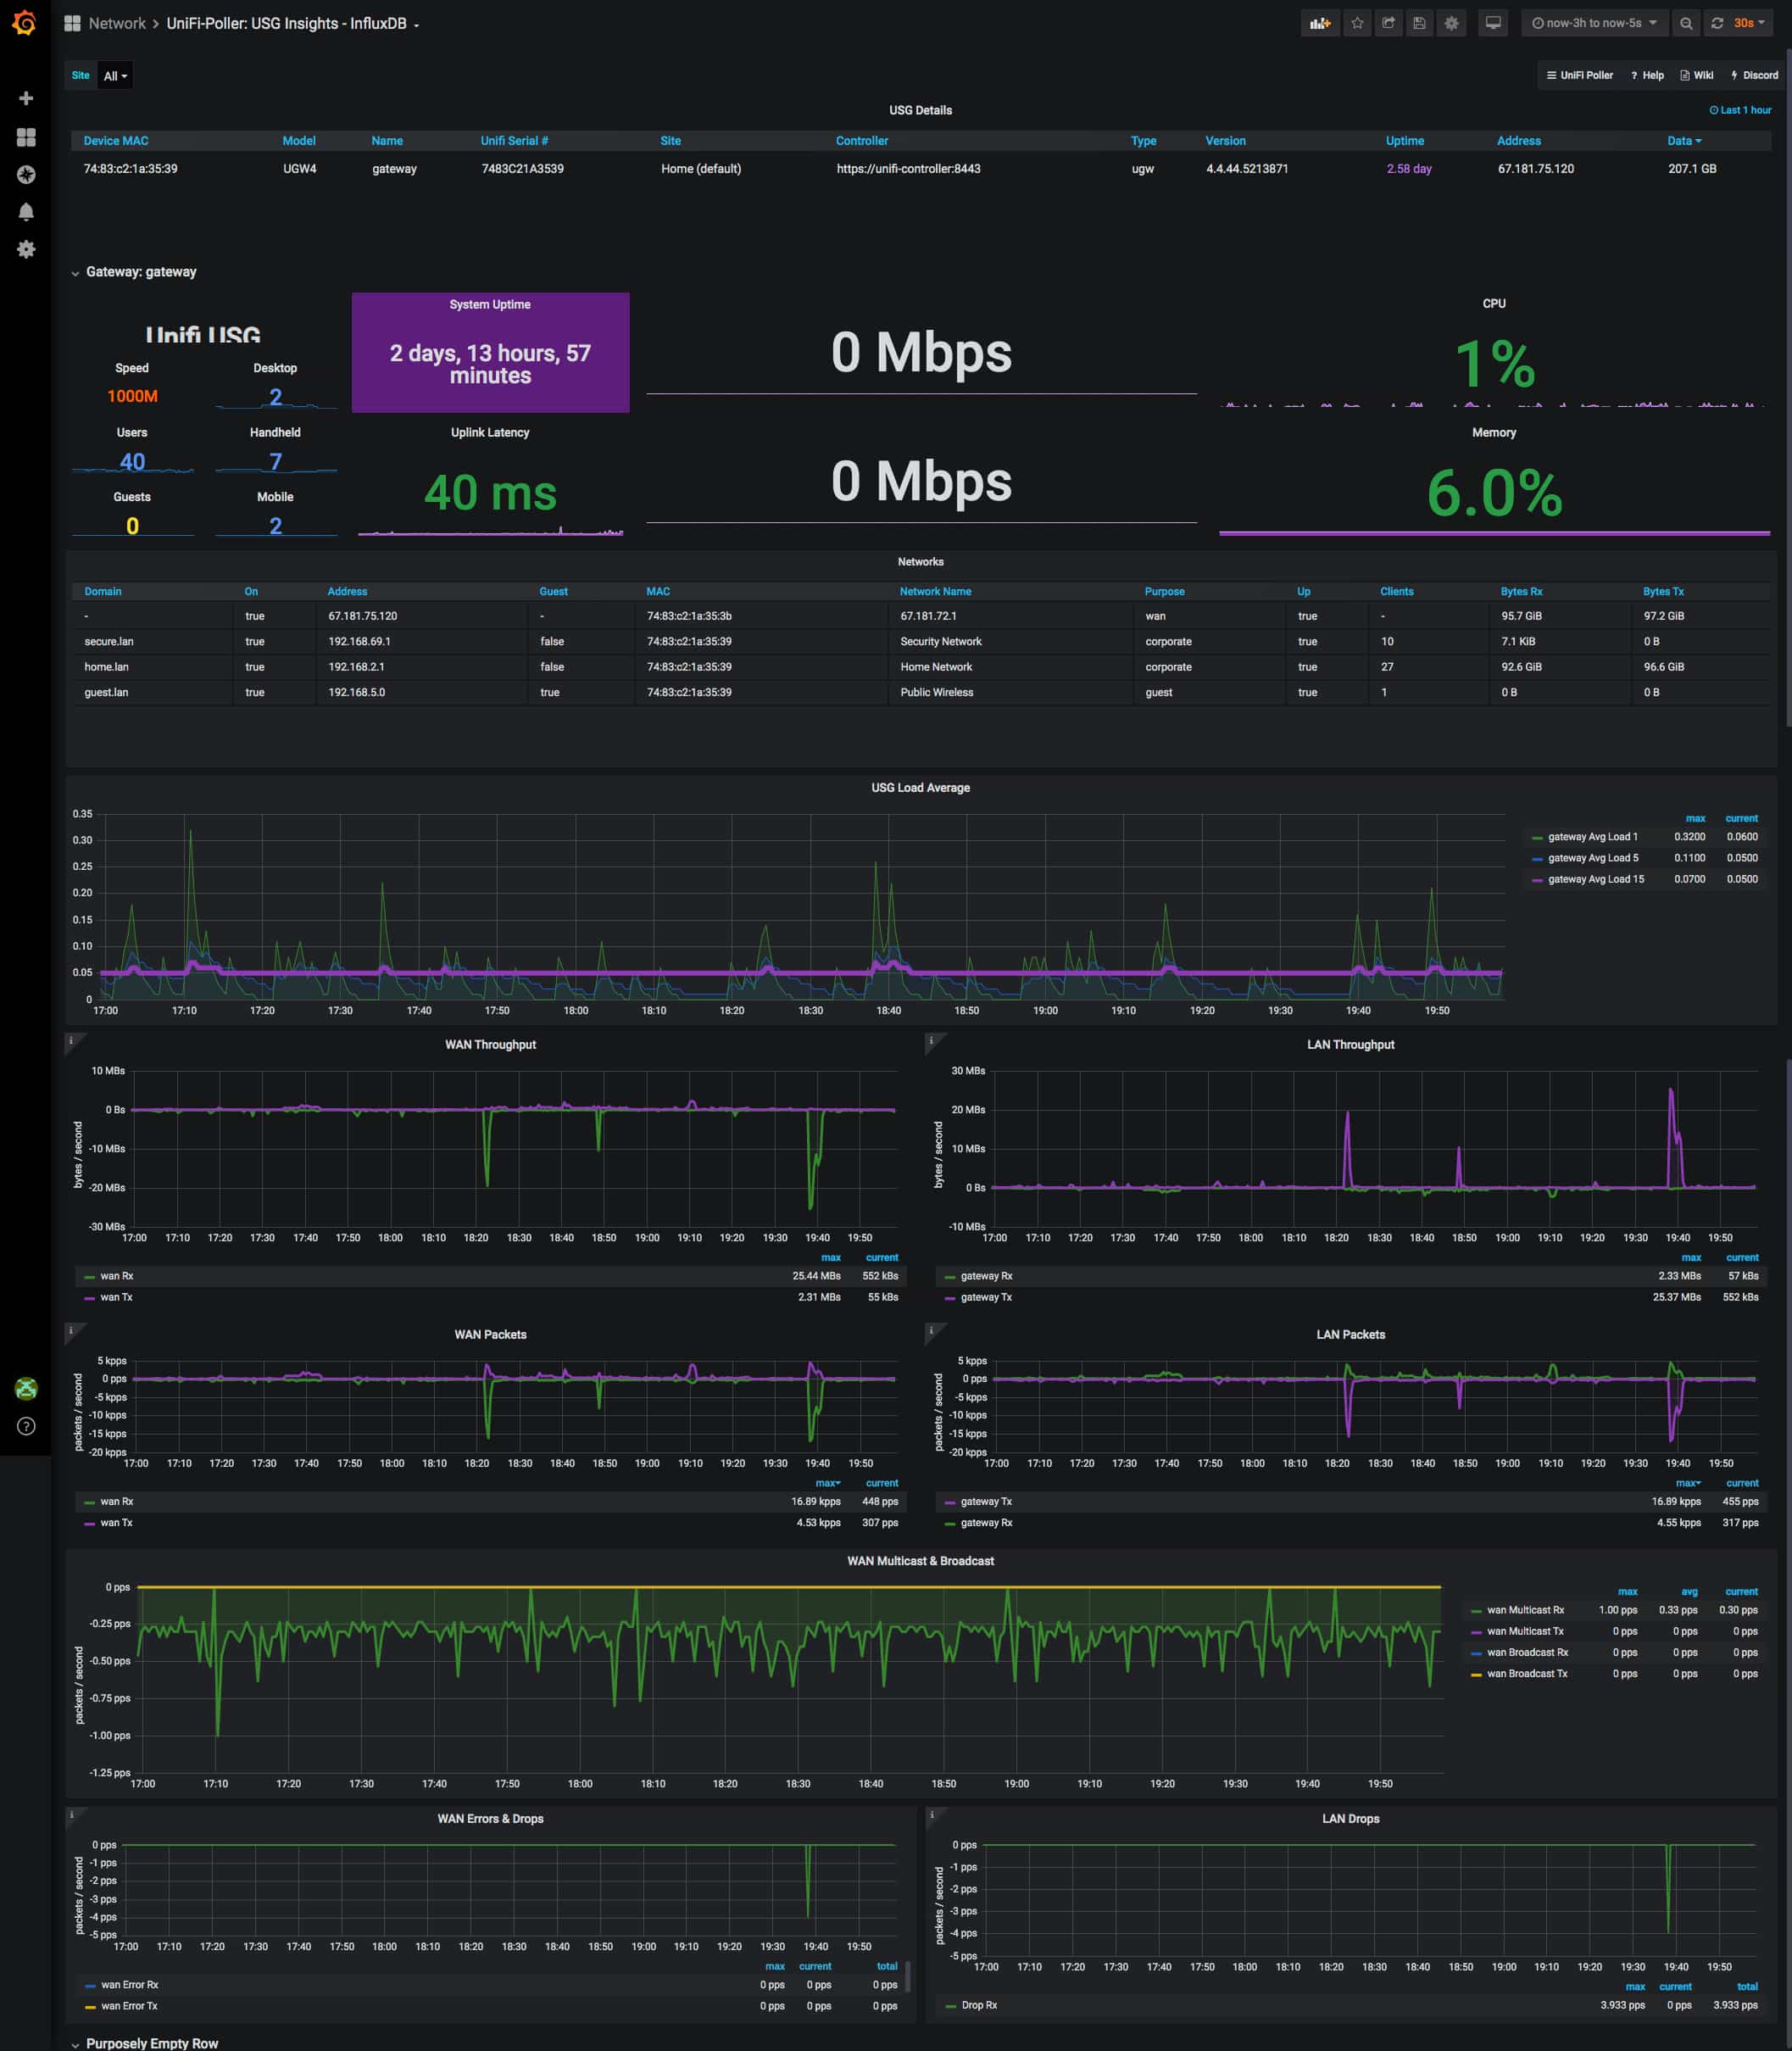
USG Dashboard (InfluxDB)
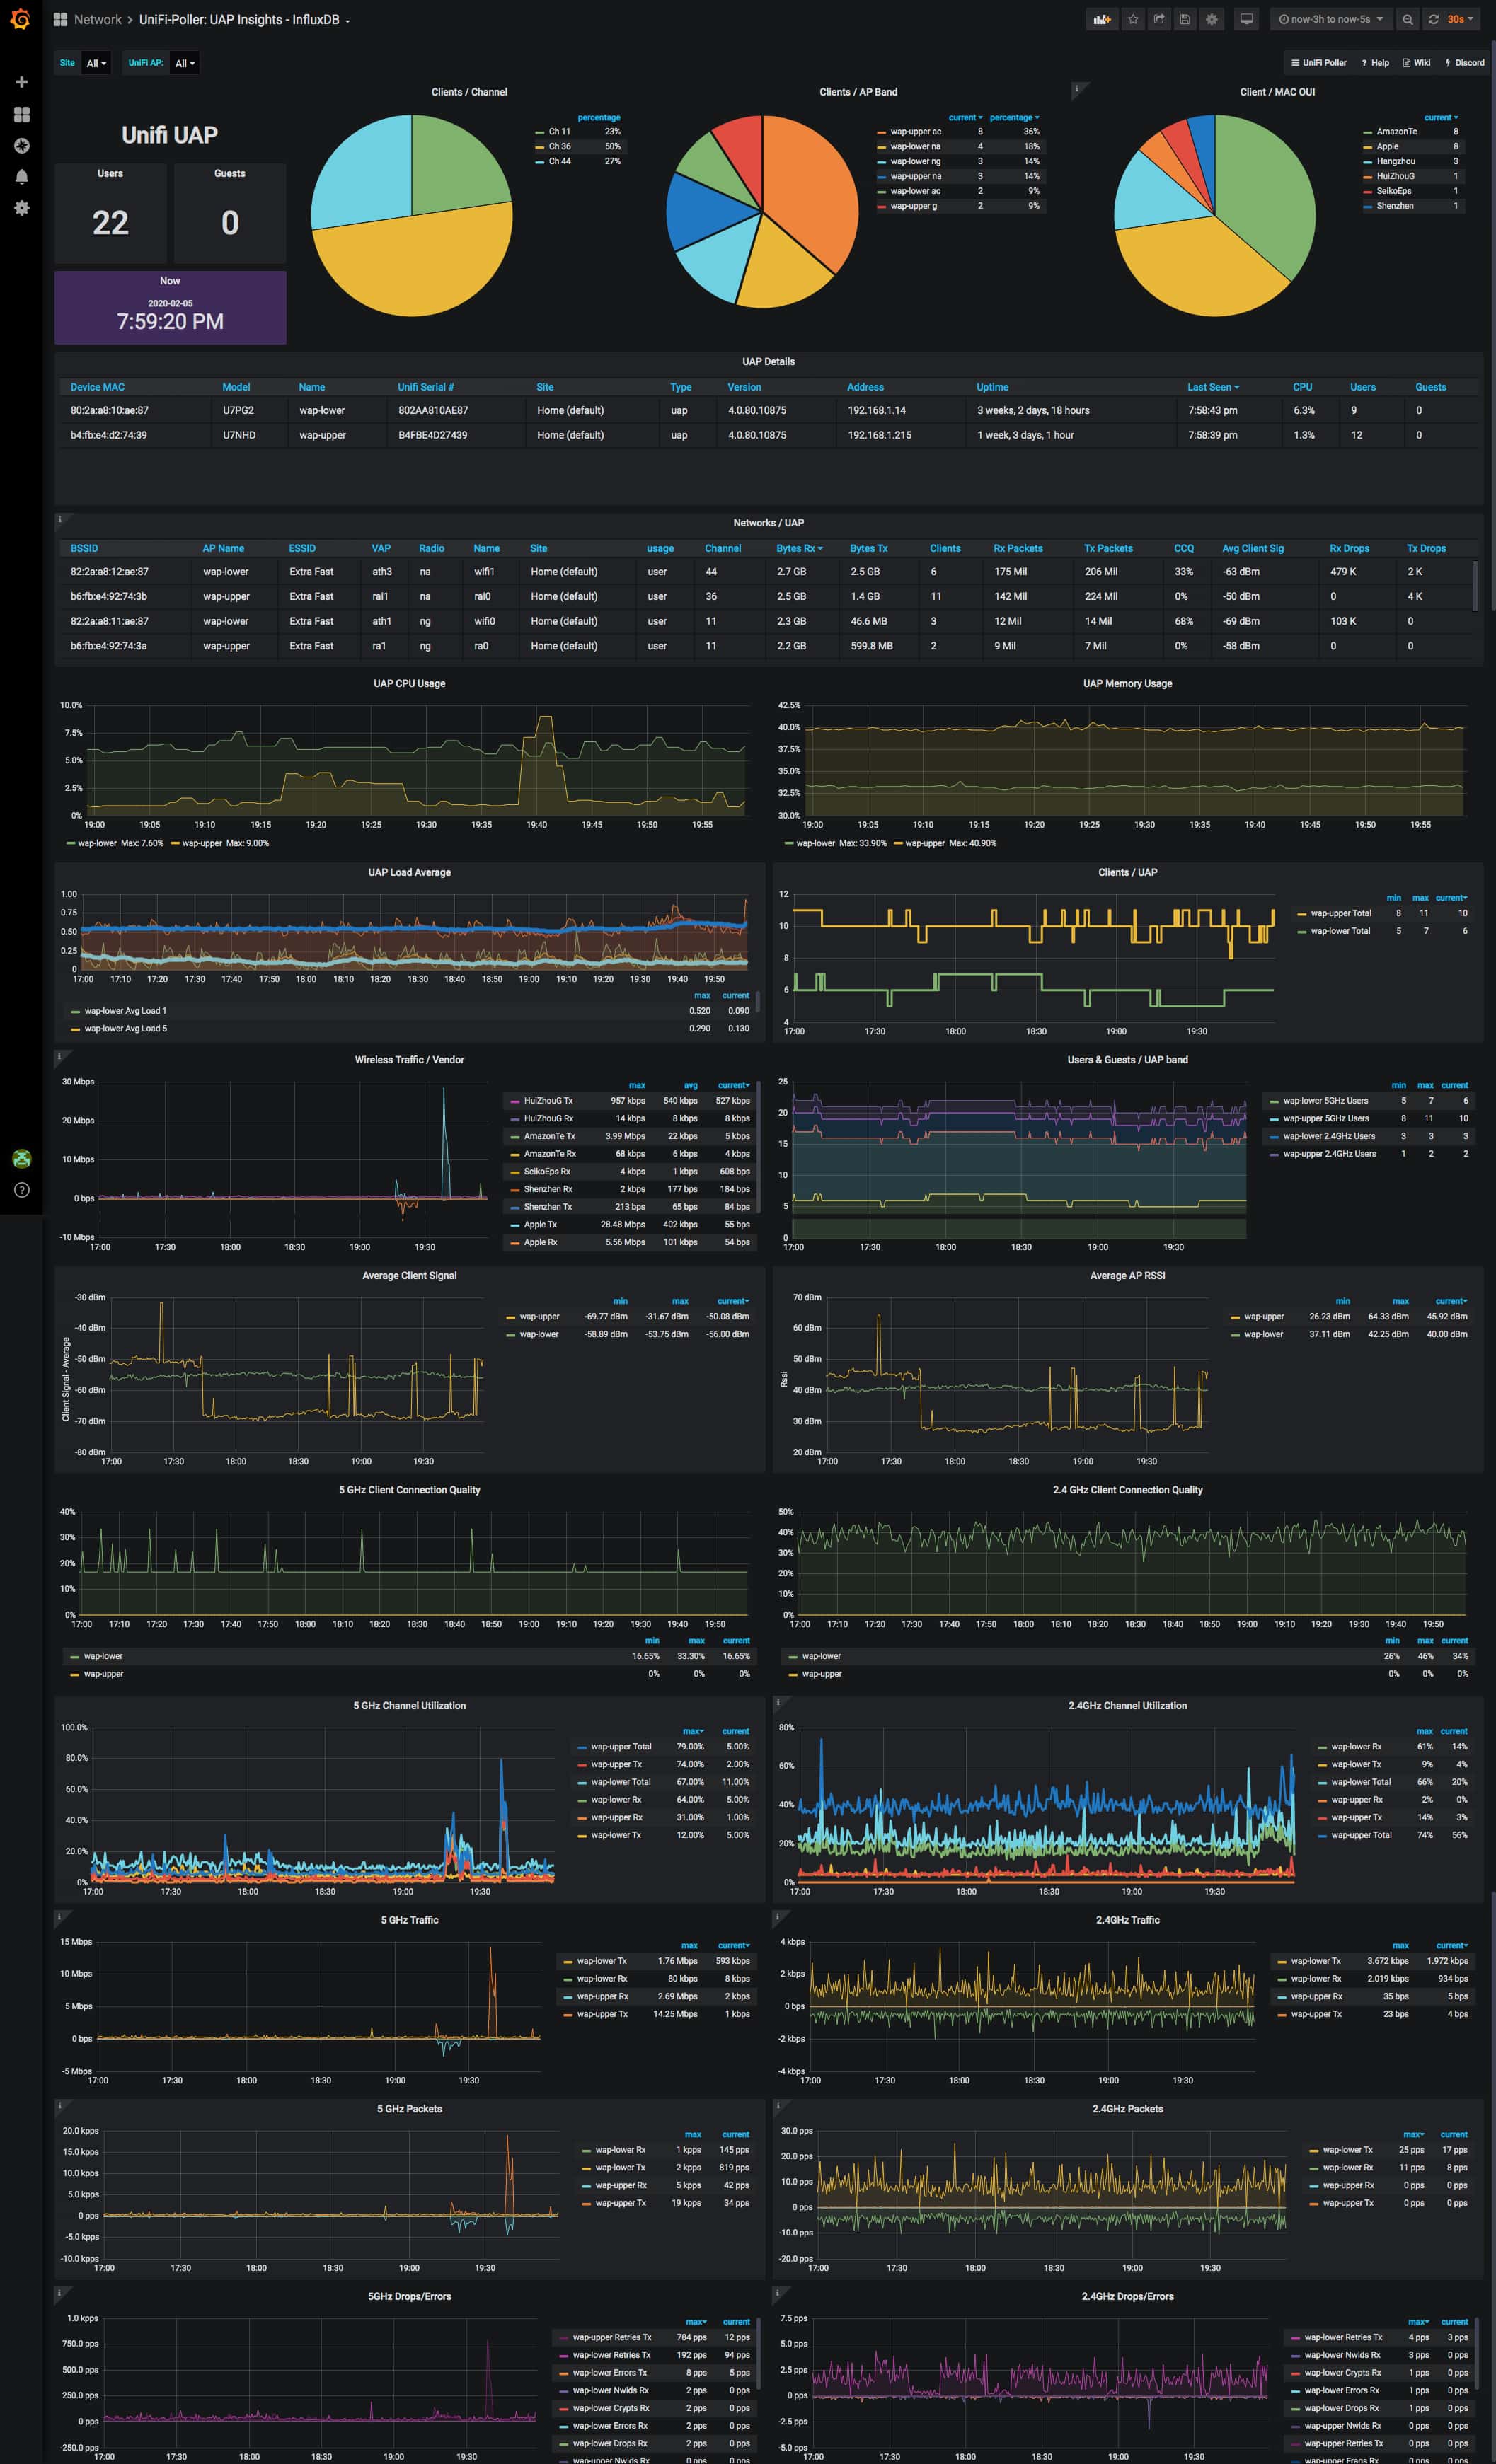
UAP Dashboard (InfluxDB)
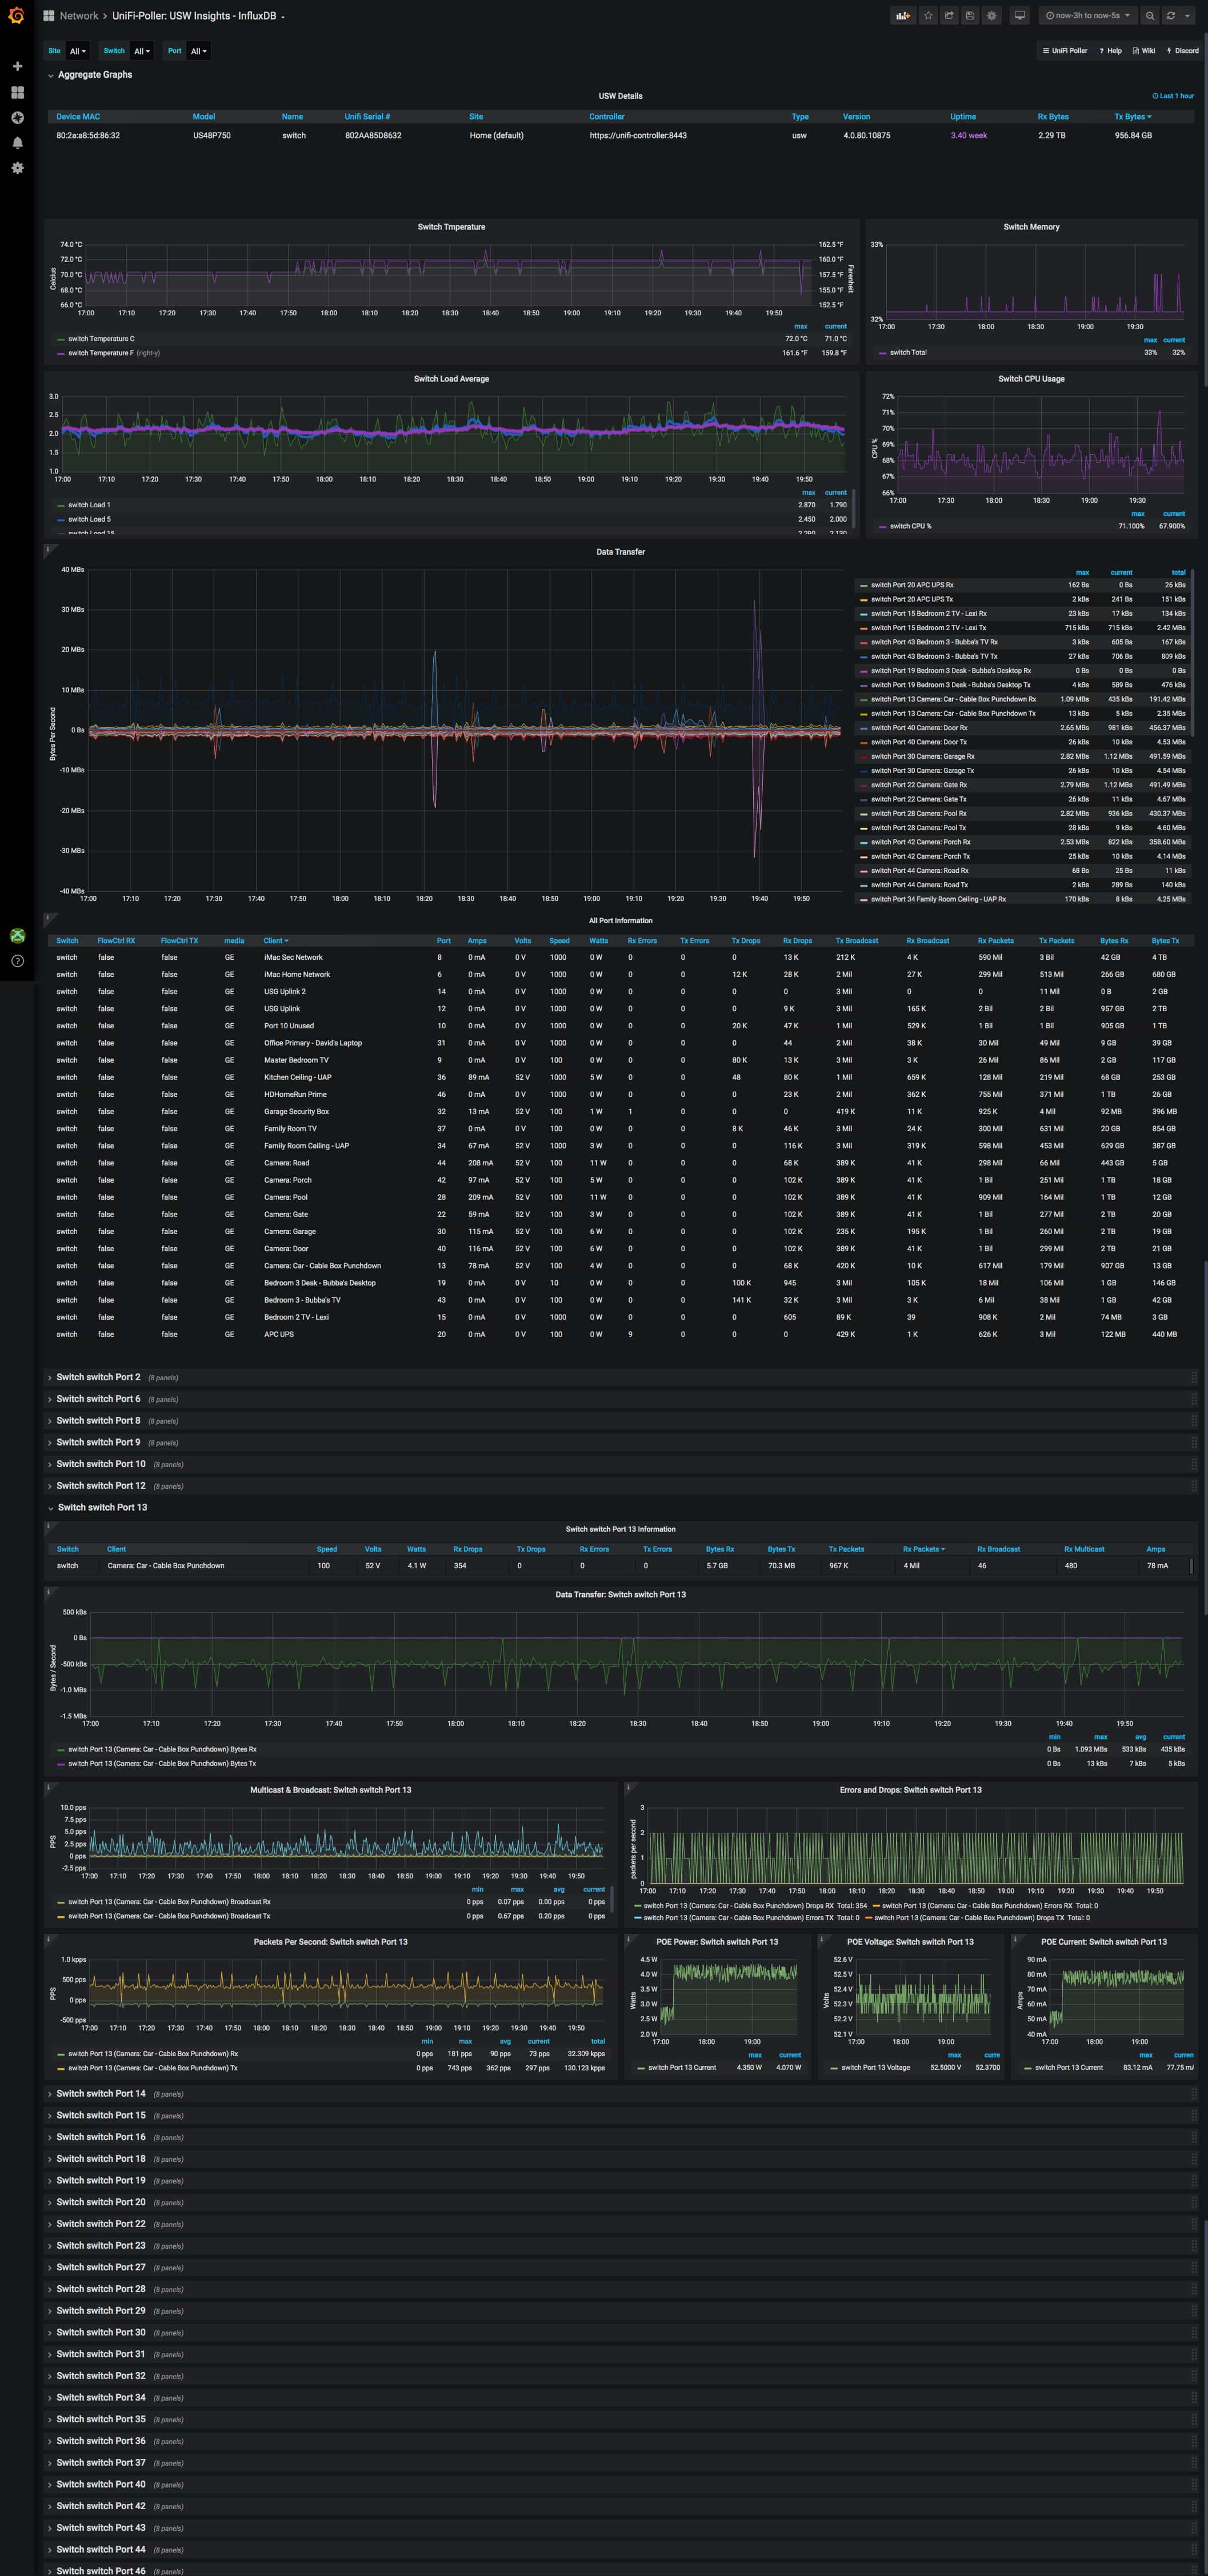
USW / Switch Dashboard (InfluxDB)
You can drill down into specific sites, switches, and ports. Compare ports in different
sites side-by-side. So easy! This screenshot barely does it justice.